Create a Service Area Map in Minutes — Free & Interactive
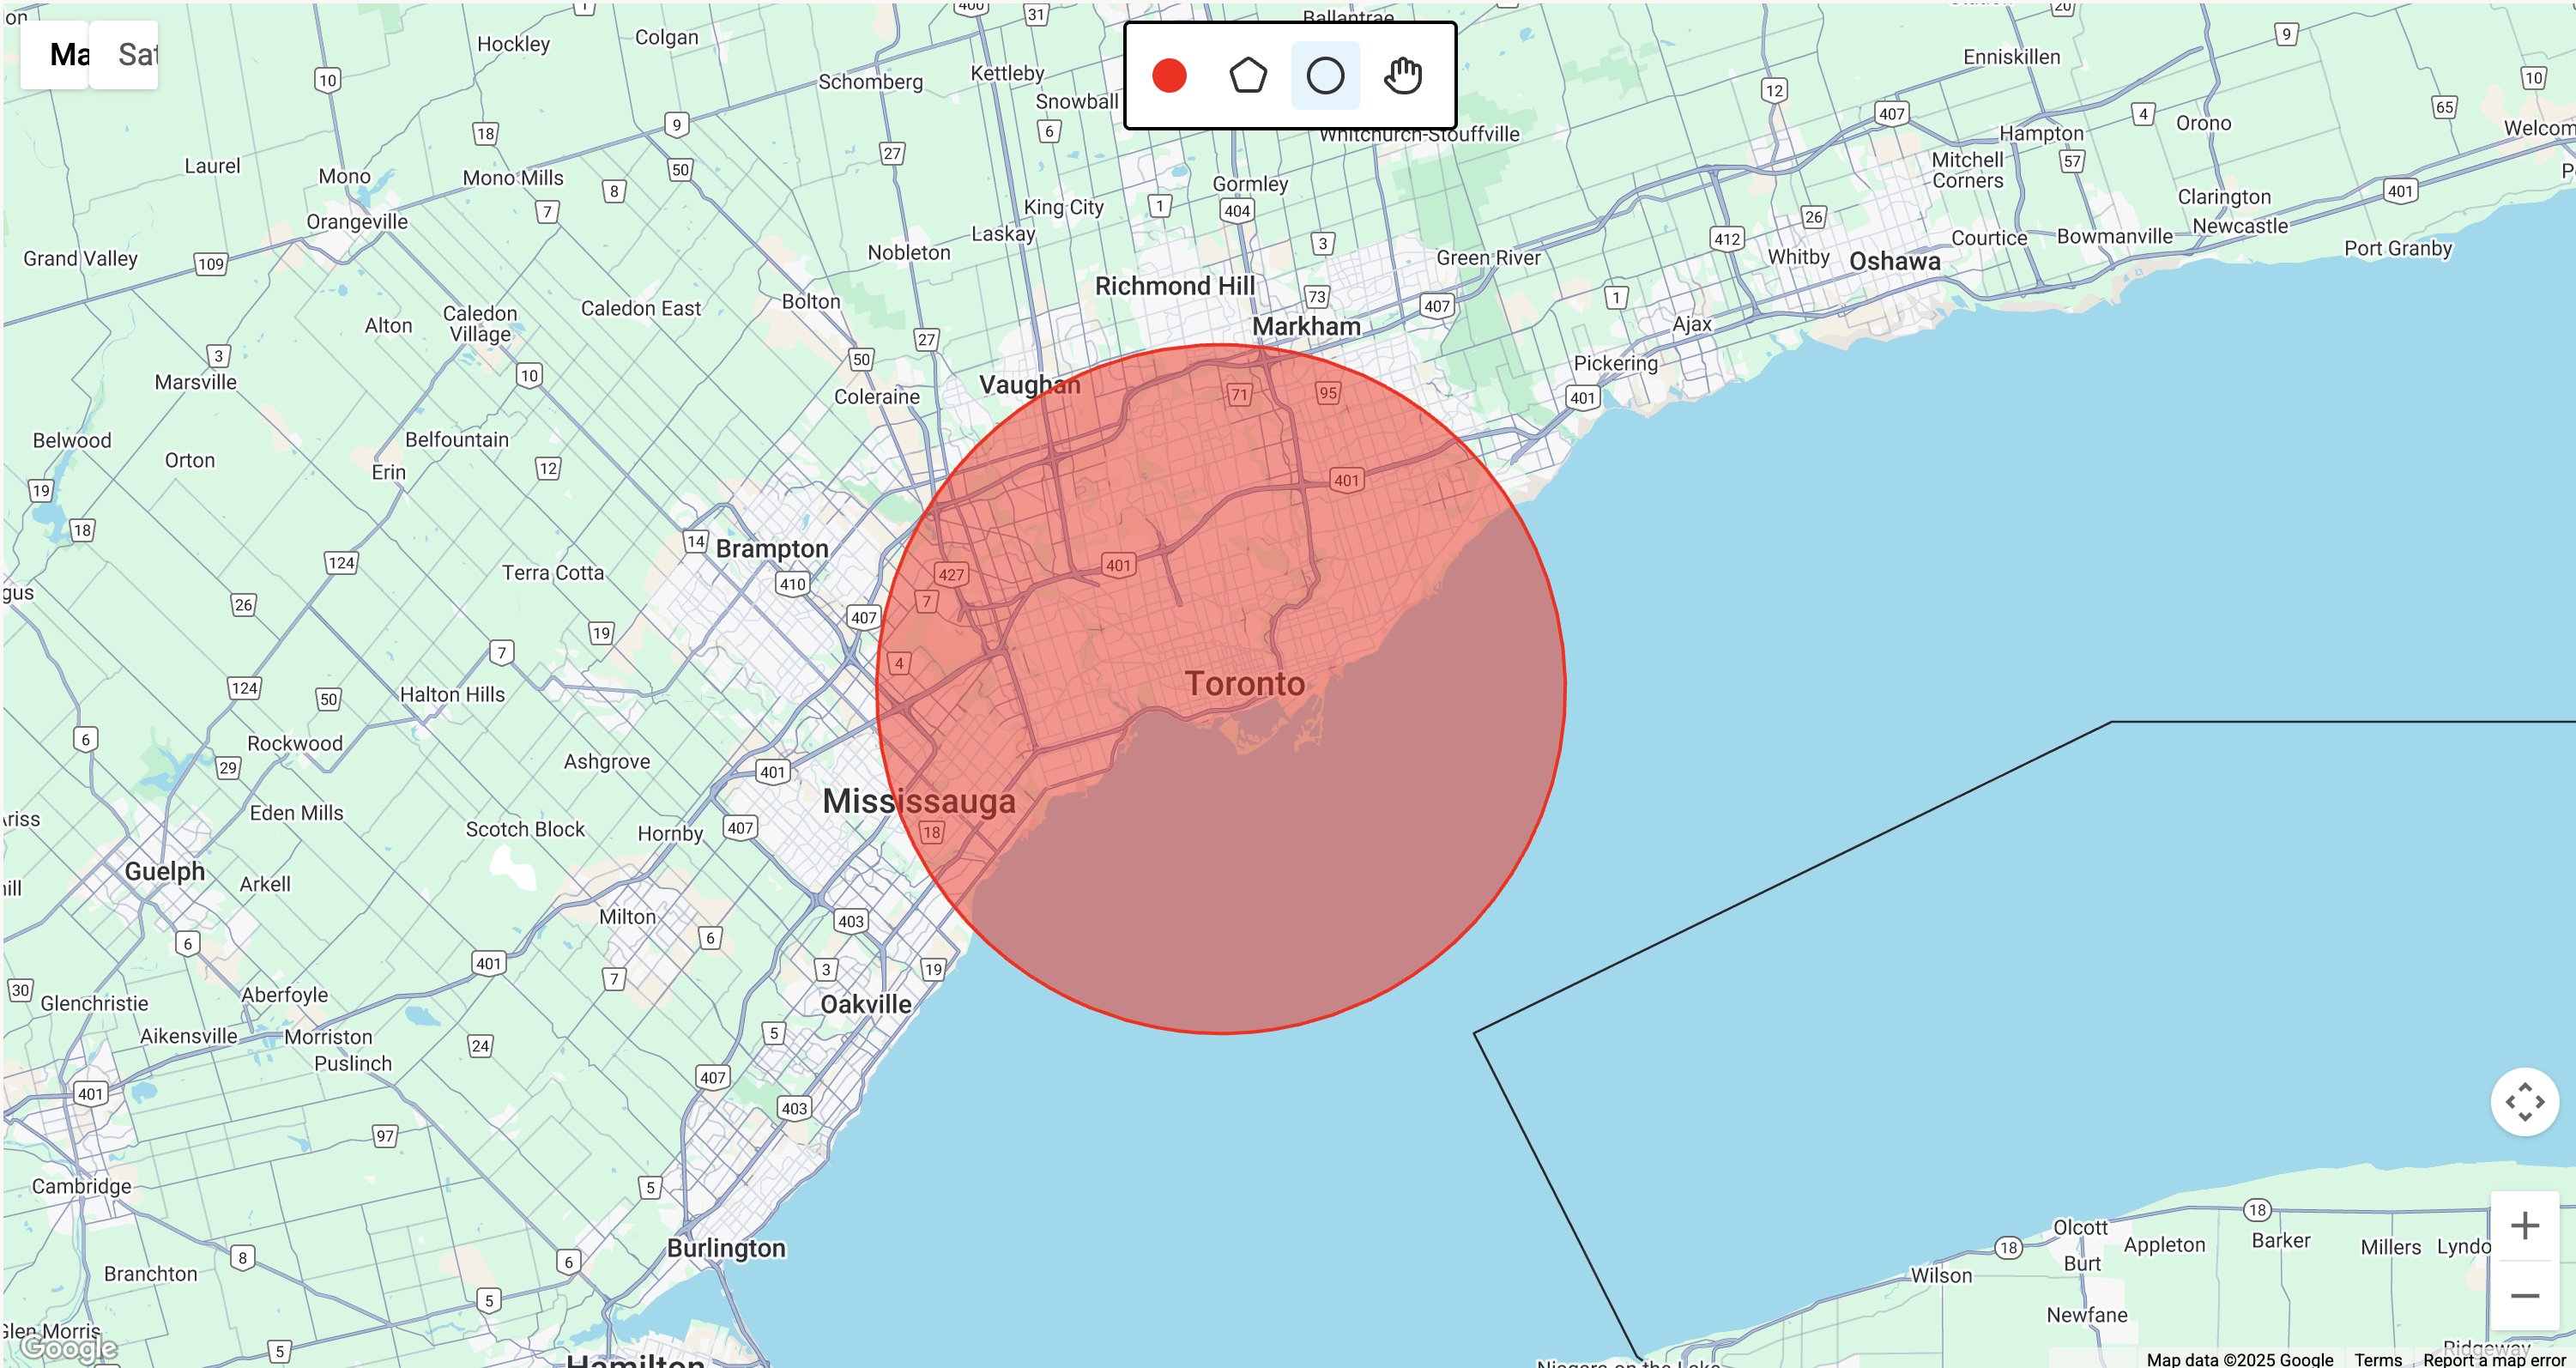
Need to show where your services are available? This free tool lets you draw service areas directly onto a map using polygons or circles. Whether you’re a service provider mapping coverage areas or a local agency sharing broadband availability, this tool makes it fast, clear, and simple.
Built with the Google Maps JavaScript API. No coding needed.

Key Features
- Polygon + Circle Tools — Draw flexible coverage zones with your mouse.
- Color Picker — Choose a fill color for your shapes so you can highlight key service availability zones.
- Zoom In / Zoom Out — Use intuitive controls to explore dense regions or zoom out for a full regional overview.
How It Works
- Pick a Tool: Use the toolbar to toggle between pan mode and rectangle drawing.
- Choose a Color: Select a color for your next shape.
- Draw a Shape: Click and drag on the map to create your polygon or circle.
- Repeat: Add as many shapes as you need—each one can be a different color.
Everything is built using the Google Maps JavaScript API, so your drawings update in real-time and stay fully interactive. Works perfectly with the broader Google Maps Platform and Google Cloud tools.
Helpful Tips
- There isn't any limit to the number of circles or polygons you can have.
- Looking to draw a circle or radius? Try our radius tool.
- Looking to draw a polygon? Try our polygon tool.
- Screenshot your final design for email, print, or presentation.
- Whether you’re mapping coverage maps, managing outages, or planning network expansion, this tool is a lightweight companion to more complex systems like ArcGIS or Google Maps Platform integrations. It’s also great for prototyping before moving to enterprise tools like ESRI.
Common Use Cases
- Municipalities mapping broadband access
- Small business showing service area
- Utility companies visualizing outages and areas eligible for a rebate
- Telecom brands like Verizon showing live coverage maps
- Government (gov) datasets distributed via ArcGIS or ESRI
- Embedding interactive maps in social media, FAQs, or alongside a disclaimer in a new window
- Providing additional information to customers about compatibility, datasets, or available services via a listed phone number
Need More?
For even more features, try Atlist—a no-code interactive map builder powered by the Google Maps Platform. Atlist includes:
- Polygon drawing and custom shapes
- Support for markers, modals, and search/filter tools
- Advanced use of the Places API and JavaScript API
- Fully responsive, embeddable maps for any website
.png)
Feedback
Got feedback or suggestions? We’d love to hear from you! Email steve@atlist.com.

